Real‑Time Sentiment Analysis API

💬 Overview
This post walks through a real-time sentiment analysis API I built to demonstrate ML engineering techniques, API design, caching strategies, and basic observability in a small code base. The service exposes REST endpoints for single and batch sentiment predictions, uses a Hugging Face transformer, caches results using Redis to reduce inference load, and surfaces operational metrics via Prometheus for visualization in Grafana.
🔗 GitHub - Real‑Time Sentiment API
Real‑World Applications
A few illustrative use cases for real-time sentiment analysis:
- Entertainment: Monitor live audience reactions to TV moments like plot twists
- Politics: Track sentiment of candidate mentions, baselined against opponents
- Commerce: Detect shifts in customer sentiment after a new product version release
Features
- 🚀 Low‑latency ML inference behind an API (FastAPI + Uvicorn).
- ⚡ Caching for cost + performance benefits (Redis).
- 📊 Instrumentation (Prometheus metrics, Grafana dashboards).
- 📦 Reproducible deployment (Docker).
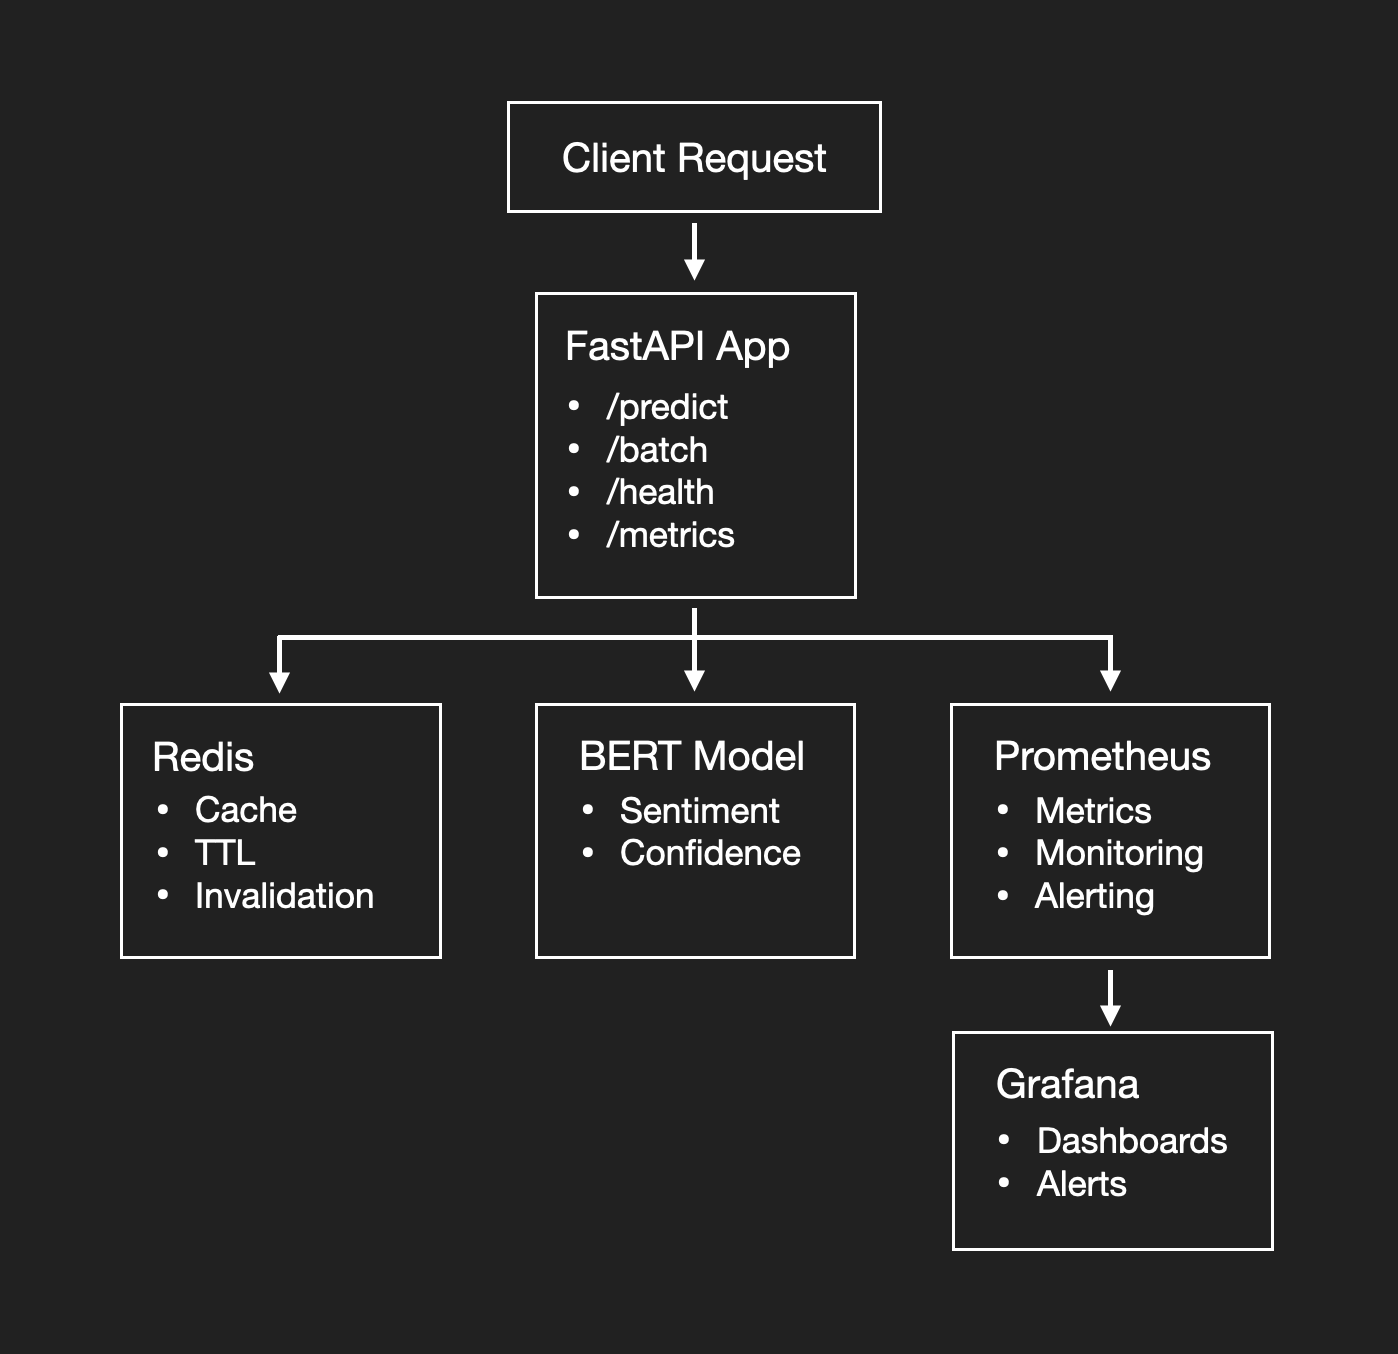
Architecture Diagram
🧠 What this Service Does
At its core, the API accepts text input and returns a sentiment label (POSITIVE, NEGATIVE, or NEUTRAL) plus a confidence score. Under the hood, it loads a transformer model (default: cardiffnlp/twitter-roberta-base, configurable) through the Hugging Face pipeline() abstraction so you don’t have to manage preprocessing or tokenization yourself.
Because transformer inference is relatively expensive compared with simple lookup work, repeated texts are cached in Redis. When an incoming request hits an already‑seen string (within a configurable TTL), the response is served from memory, drastically reducing latency and compute load.
🏗 Architecture at a Glance
| Component | Role |
|---|---|
| FastAPI app | Hosts /predict, /batch_predict, /health, /metrics, and /docs. |
| Hugging Face model | Transformer‑based sentiment classifier loaded via pipeline. |
| Redis | In‑memory cache keyed by normalized text to avoid repeat inference. |
| Prometheus | Scrapes /metrics for request counts, latency histograms, cache hits, etc. |
| Grafana | Dashboards for API performance & system health using Prometheus data. |
| Docker Compose | Spins up API, Redis, and monitoring stack locally with one command. |
Project Structure
1
2
3
4
5
6
7
8
9
10
11
12
realtime-sentiment-api/
├─ src/
│  ├─ api/          # FastAPI routes & schemas
│  ├─ model/        # HF pipeline wrapper, load/warm logic
│  ├─ services/     # Caching, batching, business rules
│  └─ monitoring/   # Metrics helpers, Prometheus exports
├─ tests/
│  ├─ unit/
│  └─ integration/
├─ monitoring/      # Prometheus config, Grafana dashboards
├─ docker-compose.yml
└─ Dockerfile
🚀 Quick Start
Goal: Clone the repo, build the containers, and hit the API locally in under 5 minutes.
Before starting, install:
- Docker 20.10
- Docker Compose 2.4+
1. Clone & Enter
1
2
git clone https://github.com/znimon/realtime-sentiment-api.git
cd realtime-sentiment-api
2. Launch the Stack
1
docker compose up -d --build
Docker Compose reads the docker-compose.yml, builds the API image, pulls Redis + monitoring images, and starts the networked services in dependency order.
3. Health Check
1
curl http://localhost:8000/health
You should get a JSON payload confirming service readiness (model load + Redis connectivity).
Try the API
Interactive Docs
FastAPI auto‑generates interactive API docs at /docs (Swagger UI) and /redoc by reading the app’s OpenAPI schema derived from the type‑annotated Python code which is super handy for quick testing.
Single Prediction
1
curl -X POST http://localhost:8000/predict   -H "Content-Type: application/json"   -d '{"text": "I really enjoy using this product"}'
The service returns the original text, sentiment label, confidence, processing time, and whether the response was served from cache.
Batch Prediction
1
curl -X POST http://localhost:8000/batch_predict   -H "Content-Type: application/json"   -d '{"texts": ["Love it", "This is awful", "Meh"]}'
Batching lets you amortize model overhead across multiple inputs.
⚙️ Configuration
The service exposes several environment variables:
| Variable | Default | What It Controls |
|---|---|---|
REDIS_URL | redis://redis:6379 | Where to connect for caching. |
MODEL_NAME | cardiffnlp/twitter-roberta-base | Hugging Face model to load via pipeline. Swap for domain‑specific models. |
BATCH_SIZE | 32 | Max batch size for inference loops; throughput vs. latency tradeoffs. |
CACHE_TTL | 3600 | Expiration (seconds) for cached predictions; tune freshness vs. cost. |
🧠 How Sentiment Inference Works (Under the Hood)
The API loads a transformer text‑classification pipeline from Hugging Face on startup, warming the model into memory so the first request isn’t cold. The pipeline() helper bundles tokenization, model forward pass, and decoding of label probabilities into simple callable usage.
Model warm‑up at process start is important in Uvicorn/Gunicorn multiprocess deployments; each worker loads its own model instance, so container memory sizing matters. Production deployments often pin worker count based on model RAM footprint.
⚡ Redis Caching Strategy
Why Cache?
Transformer inference is compute (CPU/GPU) heavy compared with a memory lookup. If the traffic includes repeated texts (UI forms, common phrases, A/B test prompts), caching reduces latency and infra cost. Redis is an in‑memory key‑value store widely used for application caching.
TTL & Invalidation
The project exposes a CACHE_TTL so cached sentiments eventually expire. This is important when the underlying models change.
📊 Observability: Prometheus + Grafana
Metrics Endpoint
The API publishes Prometheus‑formatted metrics at /metrics. Prometheus scrapes that endpoint on an interval you configure, storing time‑series data for requests, latencies, error counts, and cache effectiveness.
Dashboards
Grafana connects to Prometheus as a data source and lets you build interactive dashboards, latency percentiles, cache hit ratios, error rate panels, CPU/memory graphs for the containers, and alert rules that notify you when service level agreements (SLOs) are threatened.
📈 Sample Performance Numbers
I profiled three scenarios locally using the default model and container settings. Results will vary by hardware, but the relationship between cached vs. uncached paths is instructive:
| Scenario | Throughput | P95 Latency | Cache Hit Rate |
|---|---|---|---|
| Single (cached) | 1200 req/s | 15 ms | 100% |
| Single (uncached) | 200 req/s | 450 ms | 0% |
| Batch (10 items) | 80 req/s | 600 ms | 40% |
The step‑function jump when hitting Redis demonstrates why layering a cache in front of heavy ML models is standard practice in production systems.
📚 Learning Takeaways
System Design
- Designed a stateless API layer backed by a stateful Redis cache to decouple inference cost from request volume.
- Selected FastAPI for performance, async support, self‑documenting endpoints and demoability.
- Modeled both single and batch endpoints to illustrate latency vs. throughput tradeoffs.
- Exposed Prometheus metrics to make performance measurable and observable.
ML Engineering
- Wrapped a Hugging Face transformer with a service boundary instead of embedding inference into each app caller; centralizes model versioning.
- Demonstrated model warm‑up & caching patterns to reduce tail latency.
Operations
- Containerized everything and used Docker Compose for reproducible builds.
- Provided Grafana dashboards to visualize SLOs and error signal.
📦 Closing Thoughts
This project delivers a real‑time sentiment analysis API that’s both practical and modular:
- It wraps a Hugging Face transformer in a FastAPI web service.
- By layering in Redis caching, it minimizes inference overhead and accelerates repeat request responses.
- It integrates Prometheus and Grafana for observability: tracking latency, cache performance, and errors.
- Fully containerized with Docker
If you found this project useful and want to see more like it, your support keeps the ideas brewing: